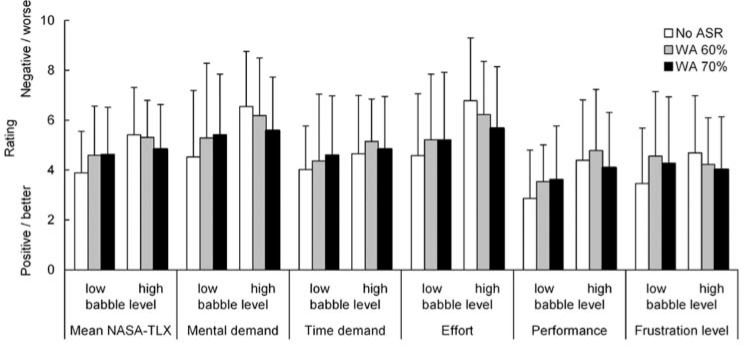
Figure 3.
Results on the NASA-Task Load Index (NASA-TLX). The mean task load is shown for each of the six conditions at th left-hand side of the figure. The other bars show the mean subscale ratings. Lower values indicate better, or more positive, ratings ASR = automatic speech recognition; WA = word accuracy.

