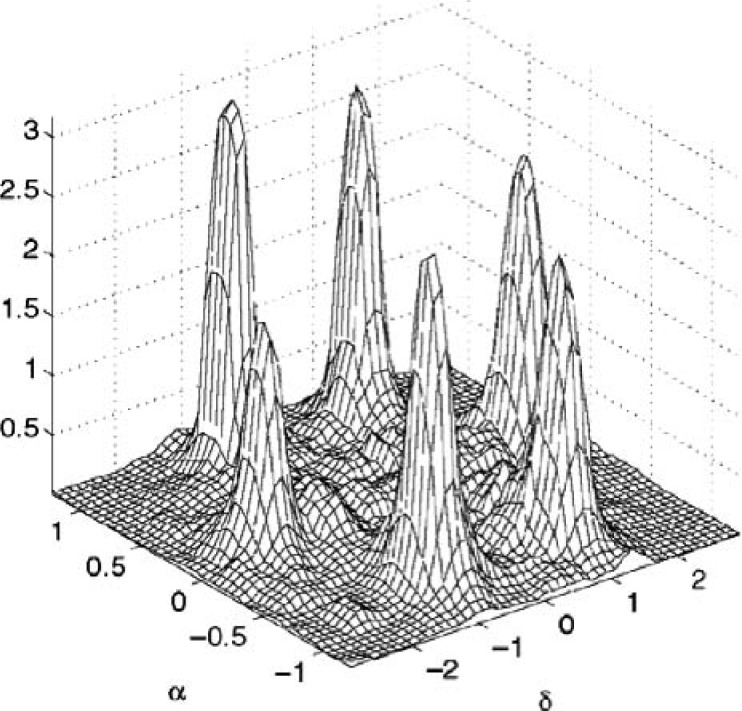
Figure 4.
Two-dimensional smoothed histogram. The histogram is generated from two 6-source mixtures, where α indicates amplitude difference and δ indicates time difference.
Source: Reprinted from Yilmaz and Rickard (2004), with permission from IEEE Transactions on Signal Processing.

