
Figure 2.
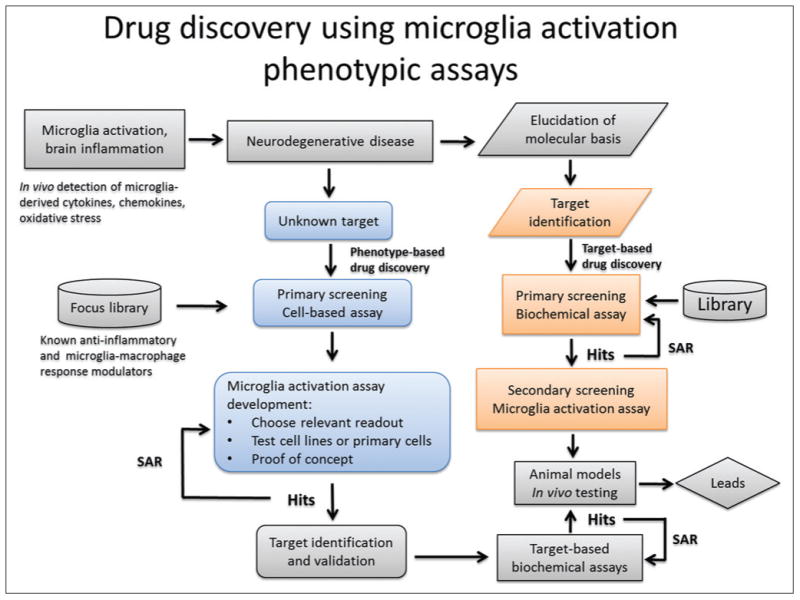
Schematic representation of work flow for primary and secondary phenotypic assay screening strategies based on microglial activation. SAR, structure-activity relationship.
Official websites use .gov
A
.gov website belongs to an official
government organization in the United States.
Secure .gov websites use HTTPS
A lock (
) or https:// means you've safely
connected to the .gov website. Share sensitive
information only on official, secure websites.
Schematic representation of work flow for primary and secondary phenotypic assay screening strategies based on microglial activation. SAR, structure-activity relationship.