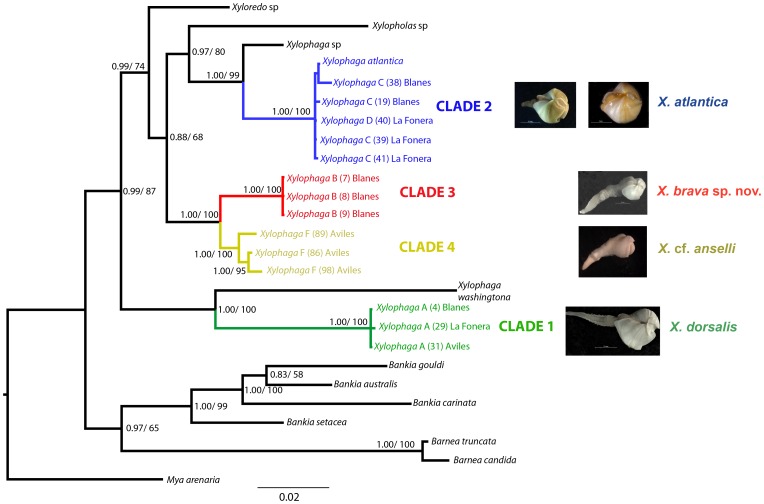
Figure 3. Bayesian Inference (BI) tree, including Maximum Likelihood (ML) bootstrap supports on the nodes, generated from sequences of the18SrDNA and 28S rDNA genes.
Values of support below 0.5 and 50% are not shown. The scale bar represents the number of nucleotide substitutions per site. Letters (A, B, C and D) after the genus name correspond to the “morphotype” of Xylophaga, and numbers in brackets to the individual codes (Table 2).

