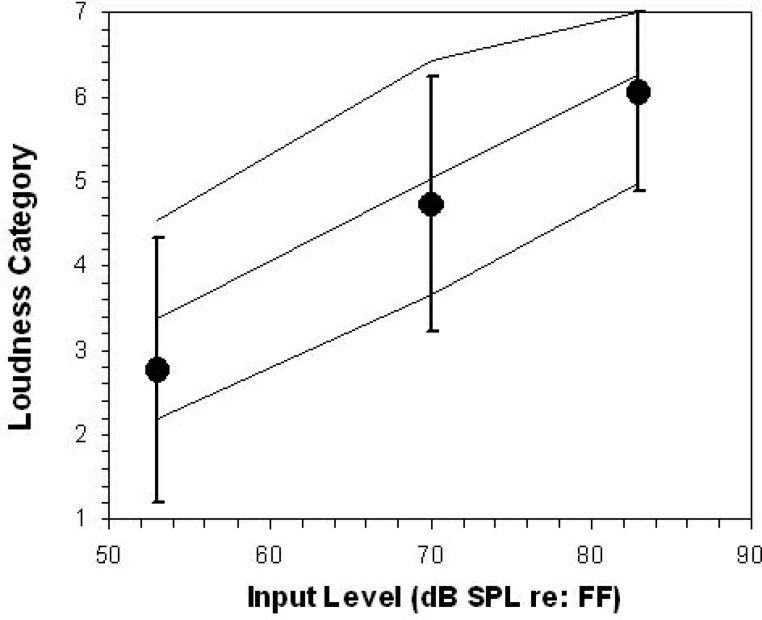
Figure 3.
Aided loudness ratings for both normally hearing listeners and hearing instrument users. The mean and the ± 2 standard deviation range for the normally hearing listeners are plotted as solid lines. The mean aided loudness ratings (•) from the hearing instrument users are shown, along with the ± 2 standard deviation range (vertical bars). Most hearing instrument users had aided loudness ratings that were within the normal range. See Table 1 for category descriptors. FF = free field.

