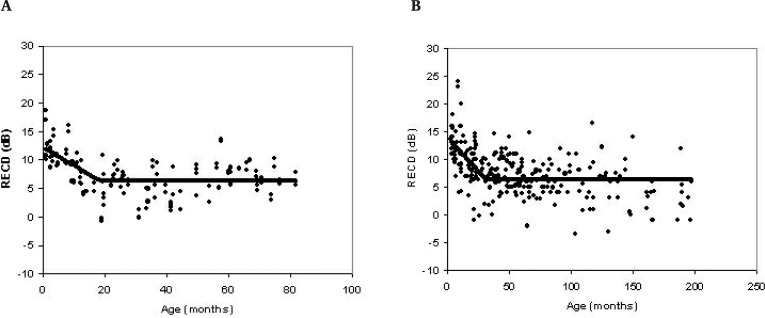
Figure 2.
Real-ear-to-coupler differences (RECD) (in dB) measured with (A) foam/immittance tips and (B) earmolds as a function of age at 3000 Hz. The sloping line indicates the linear regression represented by the prediction equation. The horizontal line represents the mean RECD values for a particular age range.

