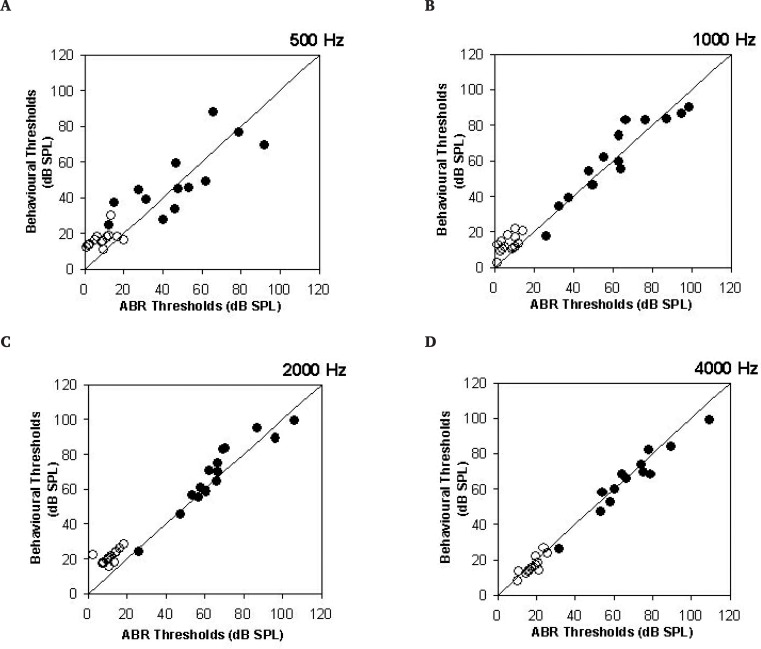
Figure 4.
Comparison of derived behavioral and auditory brainstem response (ABR) thresholds in dB SPL for (A) 500 Hz, (B) 1000 Hz, (C) 2000 Hz and (D) 4000 Hz. Filled circles indicate data for hearing impaired subjects and open circles indicate data for subjects with normal hearing. The diagonal line represents perfect correspondence.

