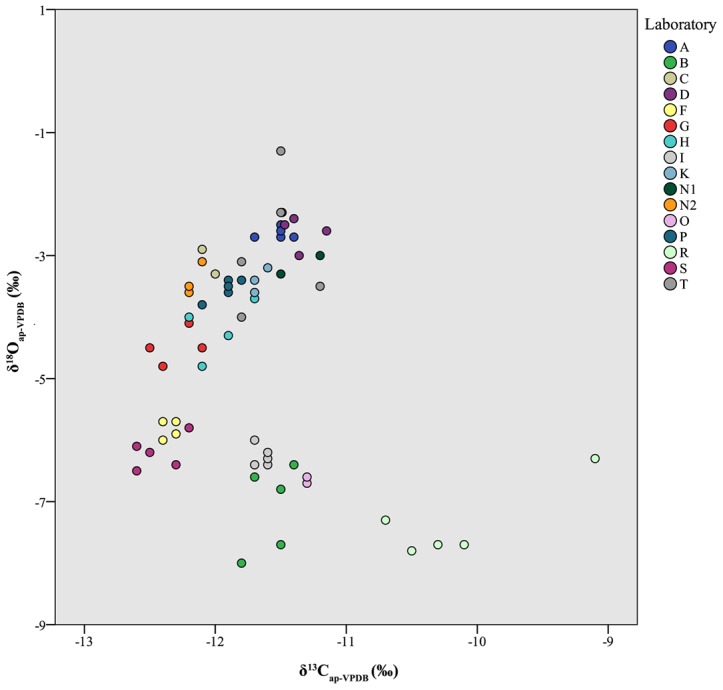
Figure 7. Scatterplot of individual δ13Cap and δ18Oap values presented for each laboratory.

High variability of δ18Oap values and outlying values of Laboratory R are both apparent.

High variability of δ18Oap values and outlying values of Laboratory R are both apparent.