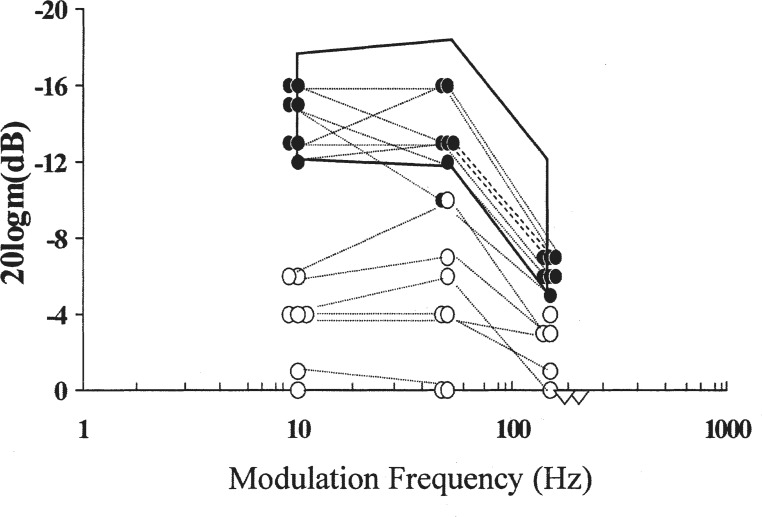
Figure 9.
Amplitude modulation detection thresholds in auditory neuropathy/dys-synchrony (AN/AD) subjects. Closed circles represent the findings for children in the AN/AD group with speech perception scores > 60%. Open circles represent the children in the AN/AD group with speech scores <30%. Open triangles show the findings for children in the AN/AD <30% group unable to detect a modulation depth of 0 dB (100%). The enclosed area shows the mean ±2 SD range for the normal group (Rance et al., 2004).

