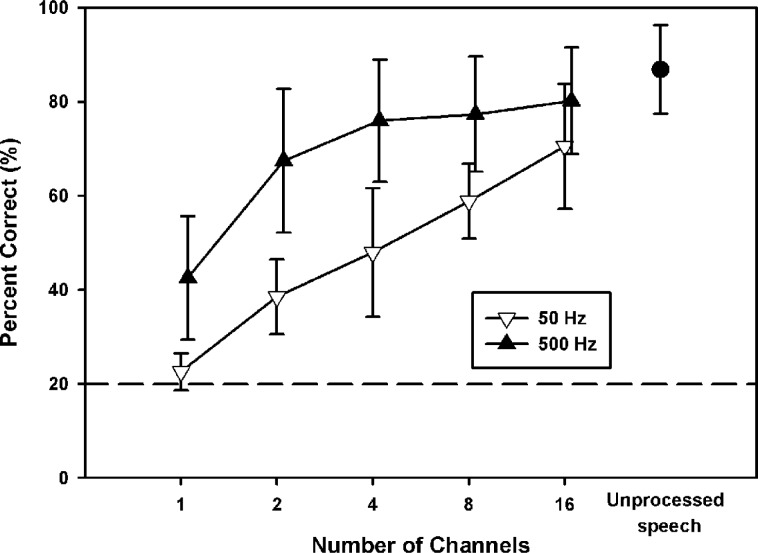
Figure 8.
Mean vocal emotion recognition scores for 6 normal-hearing subjects listening to amplitude-normalized speech via acoustic CI simulations, as a function of the number of channels. The open downward triangles show data with the 50-Hz temporal envelope filter, and the filled upward triangles show data with the 500-Hz temporal envelope filter. The filled circle shows mean performance for the 6 normal-hearing subjects listening to unprocessed amplitude-normalized speech (experiment 1). The error bars represent 1 SD. The dashed horizontal line indicates chance performance level (ie, 20% correct).

