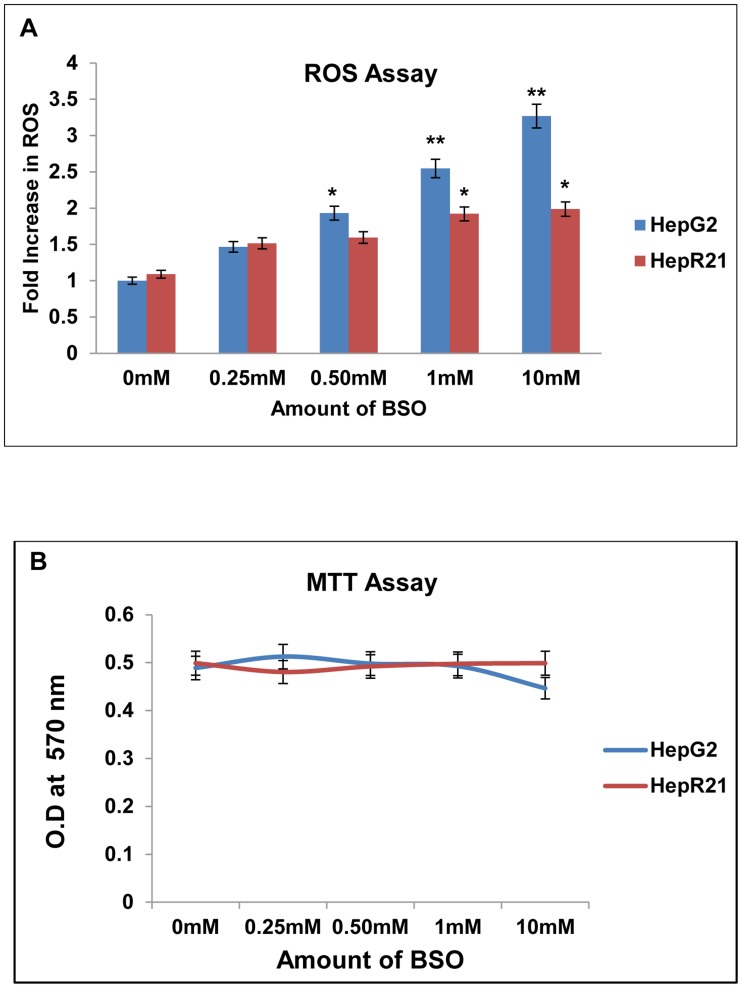
Figure 4. HepR21 cells have higher resistance to glutathione depletion compared to HepG2 cells.
[A] Significant surge in reactive oxidant level in HepG2 with exposure to BSO in a concentration dependent manner — HepG2 and HepR21 cells were treated with increasing concentrations of BSO (0.25 mM, 0.50 mM, 1 mM and 10 mM) for 24 h. ROS assay of the treated and untreated cells was performed and the fold change in ROS of the treated cells was calculated against untreated HepG2 cells taken as control. Progressive increase in ROS levels with increase in concentration of BSO in HepG2 starting from 1.5 to 3.25 folds was observed. On the contrary, HepR21 cells showed negligible increase in ROS levels initially compared to untreated HepG2 cells upon exposure to lower concentrations of BSO. Unpaired t-test using GraphPad indicated significant increase in ROS in HepG2 cells from 0.50 mM BSO treatment compared to the untreated HepG2 cells. The surge in ROS in HepG2 cells was highly significant for treatment with 1 mM and 10 mM BSO. Compared to HepG2 cells, HepR21 cells showed only a slightly significant rise in ROS levels for 1 mM and 10 mM BSO with respect to (w.r.t.) untreated HepG2 cells. Difference at a level of *p<0.05 and **p<0.005 between groups were considered as statistically significant. [B] Survivability of both HepG2 and HepR21 cells remains unaffected — Cell survivability assay performed for the abovementioned treatments indicated no detrimental effect on both the cell lines.

