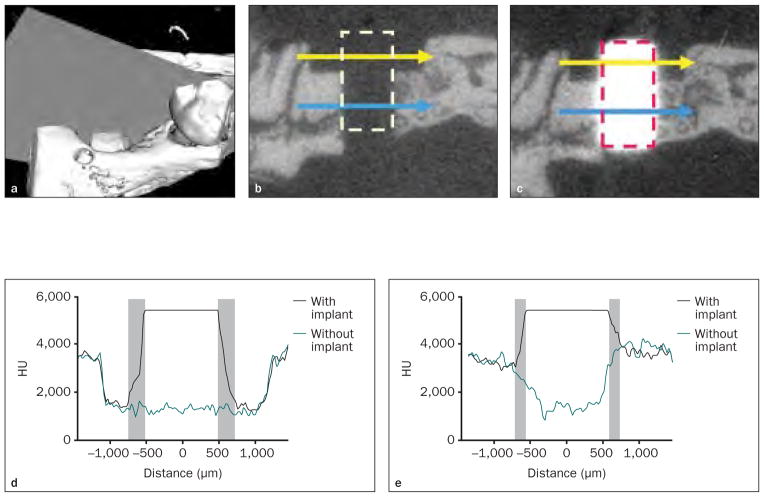
Fig 2. Effects of metal scattering on micro-CT imaging.
Fig 2a Three-dimensional micro-CT image. A single slice was selected from the central sagittal plane crossing in the osseous defect (grey plane).
Figs 2b and 2c Two-dimensional slices of micro-CT imaging (left) before and (right) after implant placement. The area marked by the dashed line refers to the space occupied by the titanium implant; the yellow line indicates the OS defect region; the blue line indicates the OA region.
Figs 2d and 2e Distribution of HU values before and after implant placement. (d) In the OS area, a 126-μm blurred zone (gray zones) on the left and a 162-μm zone on the right side of the implant were noted. (e) In the OA area, a 108-μm radiographic artifact (gray zones) was noted on both sides of the implant.

