
Fig 3.
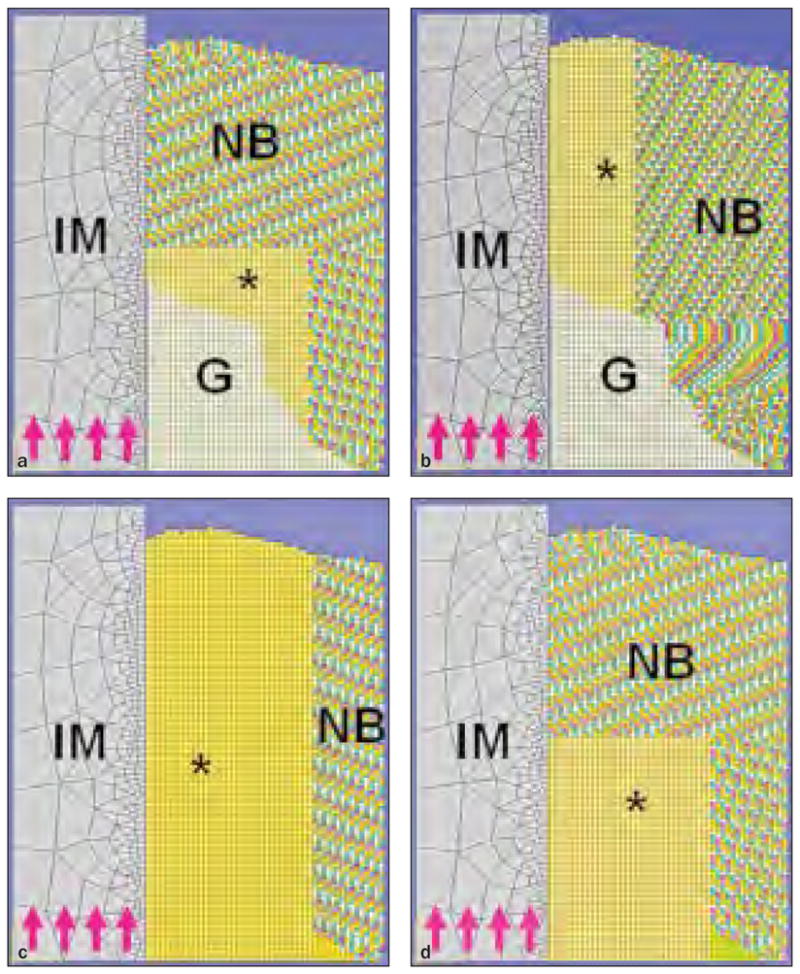
Figs 3a to 3d The FE model for calculating FBAM and FCAM. IM = titanium implant; G = granulation tissue; NB = native bone; MS = maxillary sinus; asterisks refer to area of investigation; purple arrows indicate the direction of simulated load.
Fig 3a FBAM for osseous wound repair.
Fig 3b FBAM for interfacial osseointegration.
Fig 3c FCAM for interfacial osseointegration.
Fig 3d FCAM for osseous wound repair.