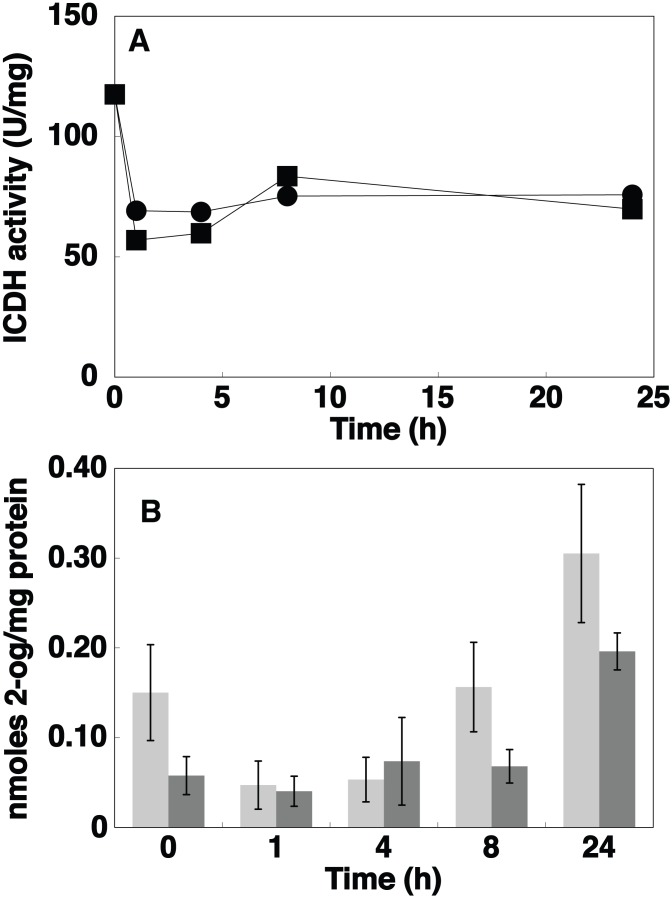
Figure 3. Effect of nitrogen starvation.
A, Time course of ICDH activity in Prochlorococcus sp. strain PCC 9511 cultures (squares, control cells; circles, N-starved cells). B. Time course of 2-OG concentration (light grey, control cells; dark grey, N-starved cells). Values are the average of three independent biological replicates, each of them measured in triplicate. Error bars correspond to the standard deviation.

