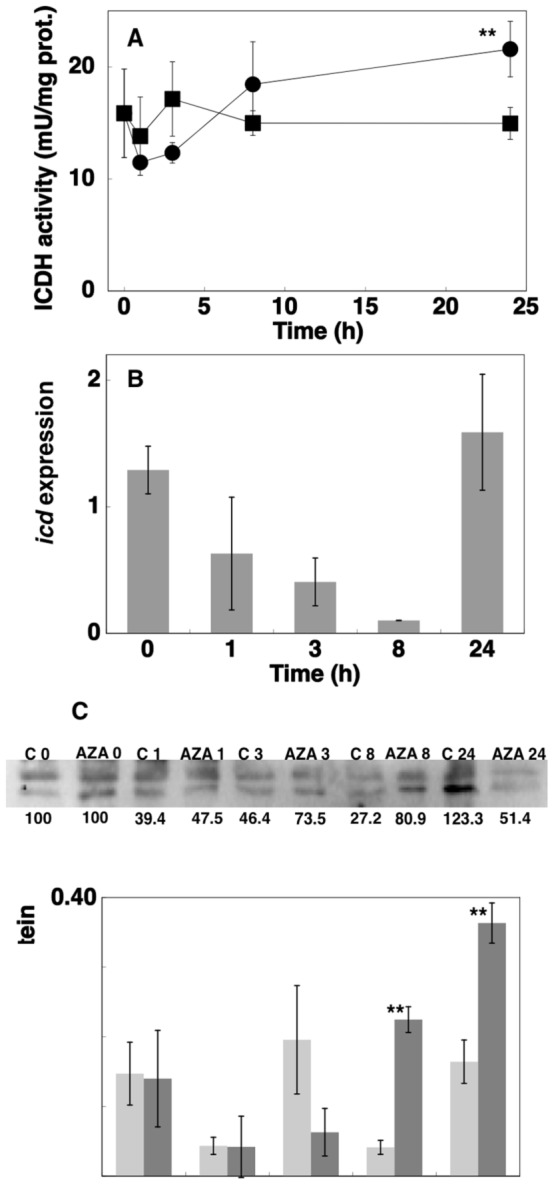
Figure 5. Effects of azaserine addition on ICDH activity, icd expression, ICDH enzyme concentration and 2-OG concentration.

A, Effect on ICDH activity in Prochlorococcus sp. strain PCC 9511 cultures (▪, control cells; •, cells in the presence of 100 µM azaserine). B, Effect on icd expression in Prochlorococcus sp. PCC 9511 cultures. C, Western blotting from cultures under control conditions or subjected to 100 µM azaserine addition. Lanes are marked with C (control) or AZA (azaserine), followed by sampling time (in hours). Quantitation of bands is shown below the picture, assigning an arbitrary value of 100 to the time 0 of each series (control, azaserine). D, Time course of 2-OG concentration (light grey, control cells; dark grey, azaserine-treated cells). Values are the average of at least three independent biological samples. Error bars correspond to the standard deviation.
