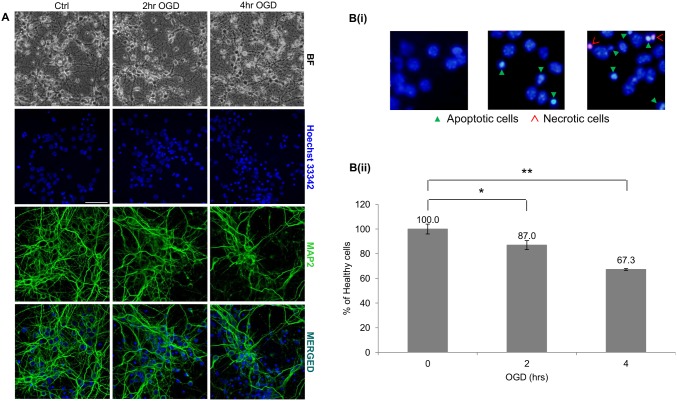
Figure 4. Primary neurons subjected to oxygen and glucose deprivation (OGD).
(A) Bright-field immunostained images illustrating cell death in healthy neuronal cultures subjected to OGD. Cells subjected to increasing ischemic injury displayed degenerated neurites. BF-Bright-field; Green-MAP2; Blue-Hoechst 33342. Scale bar represents 50 µm. (Bi) Primary neuronal cultures subjected to OGD were stained with the nuclear stain, Hoechst 33342 (blue), and necrotic cells marker, Ethidium homodimer III (red). Exposure to OGD showed an increase in apoptotic cells, indicated by condensed nuclei (green arrow heads) and necrotic cells (red open arrow heads). (Bii) Healthy cells were expressed as a percentage (mean ± SD) of the total cells. All experiments were carried out n = 4 and in triplicates. Statistically significant differences were tested using the Student’s t-test (*p<0.05, **p<0.01).

