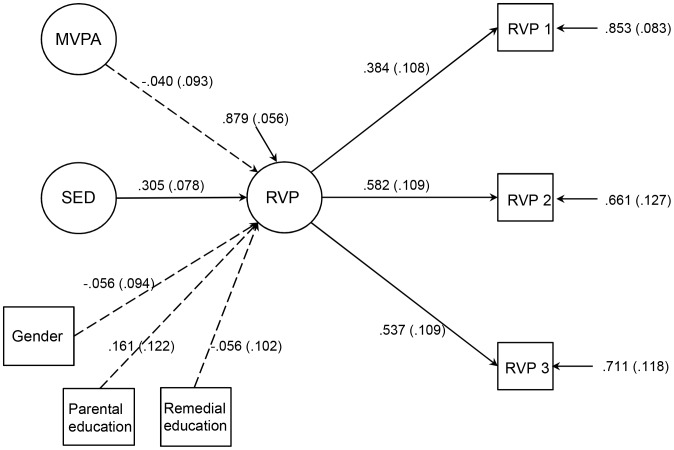
Figure 2. Objectively measured sedentary time and performance in sustained attention test.
This figure presents the estimation results of the model for the associations of objectively measured MVPA, sedentary time (SED) and the Rapid Visual Information Processing (RVP) test. Standardized parameter estimates and standard errors are presented. The RVP (multiplied by 10) of the three blocks of the test (RVP 1, RVP 2, RVP 3) were used as indicator variables in the structural equation modeling. The scale for the RVP test result (A’) is 0.00–1.00, where 0.00 indicates a poor result and 1.00 a good result. Confounding factors, gender (female), the highest level of parental education (tertiary level) and child’s need for remedial education (yes) were taken into account. Highly correlated objectively measured MVPA and sedentary time were added to the model as latent variables.

