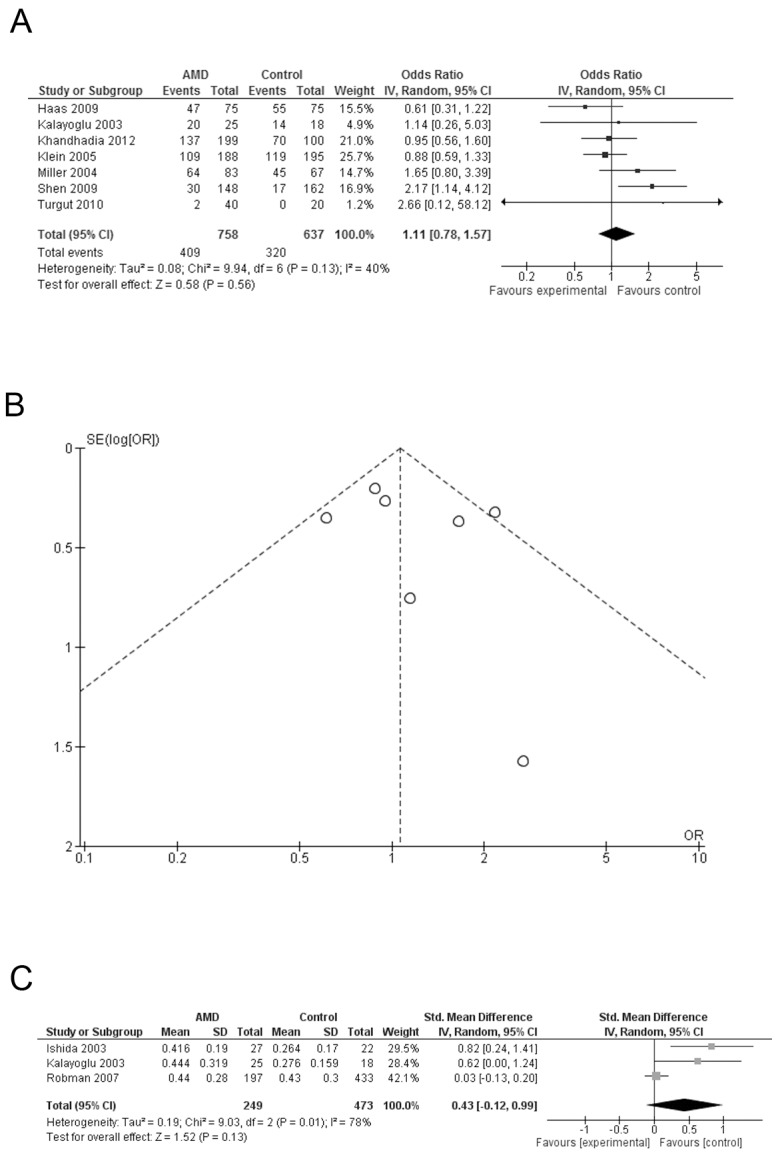
Figure 2. Meta-analysis of the serologic association of with Chlamydia pneumoniae and the prevalence of AMD.

A: Forest plot comparing the positive rate of Chlamydia pneumoniae infection between AMD cases and controls; squares indicate study-specific odds ratio (OR). B: Funnel plots for positive rate of Chlamydia pneumoniae infection between AMD cases and controls; C: Forest plot comparing the IgG antibody titers of Chlamydia pneumoniae infection between AMD cases and controls; squares indicate study-specific standardized mean difference (SMD). The size of the box is proportional to the weight of the study; horizontal lines indicate 95% confidence interval (CI); diamond indicates summary OR or SMD with its corresponding 95% CI.
