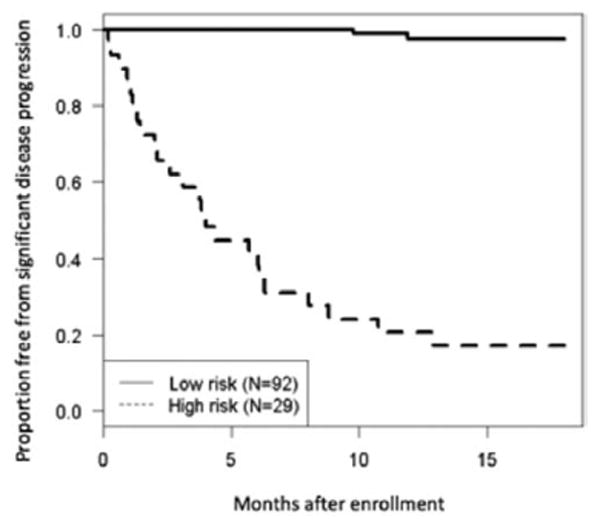
Figure 4.

Kaplan–Meier curve demonstrating patients at high risk of disease progression versus low risk. Definition of risk was based on whether patients met criteria on the classification and regression tree analysis for significant disease progression using all 4 tiers
