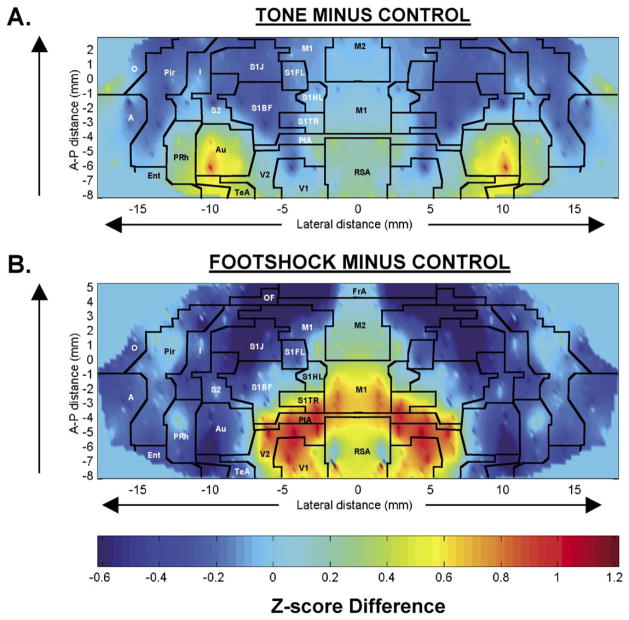
Fig. 1.
Maps of the color-coded average Z-score differences for (A) rats exposed to an acoustic challenge and control animals exposed to no tone, i.e. Z scoreTone minus Z scoreControl; and (B) rats exposed to electric shock and control animals, i.e. Z scoreShock minus Z scoreControl. In these two-dimensional maps of the flattened cortex, the x- and y-coordinates are obtained from measures of the anatomical distances within the autoradiographs. The x-axis (locations) represents lateral distance from the midline (in mm) along the cortical rim within a slice. The y-axis (slices) represents coronal slices, numbered from rostral to caudal, with distance relative to bregma in millimeters (positive values being rostral to this landmark). Coronal sections used to generate the figures are described in Tables 1 and 2. To avoid discontinuities in the graphic representation, the space between each coronal slice and the 12–20 locations within each slice, where there were no measurements, was filled with values calculated by linear interpolation (IMaximum interpolation distance 1000 μm). Superimposed on the maps are the borders of the main cortical areas [14]: A, cortical amygdaloid nucleus; Au, auditory; Ent, entorhinal; FrA, frontal association; I, insular; M1, primary motor; M2, secondary motor; O, olfactory; OF, orbital frontal; PtA, parietal association; Pir, piriform; PRh, perirhinal; RSA, retrosplenial. Primary somatosensory mapping: S1FL, the forelimbs; S1HL, the hindlimbs; S1TR, the trunk; S1BF, the barrel fields; S1J, the jaw, lip, and oral region. S2, secondary somatosensory; TeA, temporal association; V1, primary visual; V2, secondary visual.

