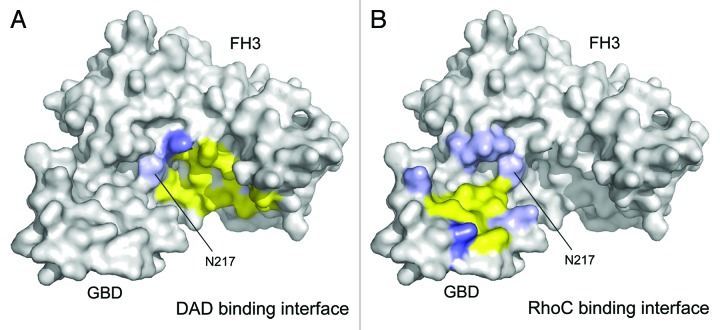
Figure 5. Display of the autoinhibitory and activating binding interfaces on mDia1 GBD-FH3 domains. (A) DAD binding interface on mDia1. Displayed are interacting residues derived from the mDia1 FH3–DAD complex structure 2F31 (ref. 16) and highlighted on the GBD-FH3 structure 1Z2C (ref. 32). Hydrogen bonds are formed between N217, N310, and Q352 (colored light blue) of the FH3 domain and the DAD. A salt bridge to D1183 of the DAD is mediated by K213 (colored blue) and hydrophobic interactions to the DAD motif are contributed by I222, K252, L253, A256, I259, L260, Q307, A311, T314, V351, and V355 (colored yellow) of the FH3 domain. (B) Display of the RhoC binding interface on mDia1 GBD-FH3 based on the evaluation provided in the 1Z2C structure.32 Polar interactions to the GTPase are formed by K100 and Q118 of the GBD and N164, N165, N166, and N217 of the FH3 domain. A salt bridge is mediated by K107 and hydrophobic interactions are formed by M90, M94, N95, L96, P103, L104, and M115. Only N217 on the second armadillo repeat of the FH3 domain is in the intersection of the binding interface between the inhibiting and activating complex.

An official website of the United States government
Here's how you know
Official websites use .gov
A
.gov website belongs to an official
government organization in the United States.
Secure .gov websites use HTTPS
A lock (
) or https:// means you've safely
connected to the .gov website. Share sensitive
information only on official, secure websites.
