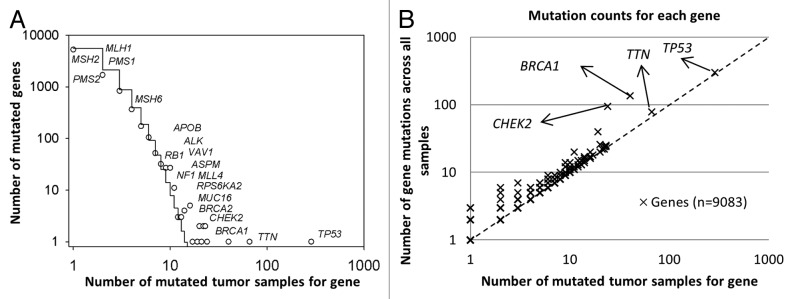
Figure 1. Statistical characteristics of gene mutations in HG-SOC. (A) Frequency distribution of mutations in susceptible driving genes. (B) Number of distinct mutations against number of mutated samples. Scatter plot of genes, where the vertical axis corresponds to the number of mutations across all samples and the horizontal axis corresponds to the number of samples with at least one mutation for a given gene. The diagonal represents the hypothetical scenario where number of mutations per sample for each gene is 1. Both axes are log10-transformed.
