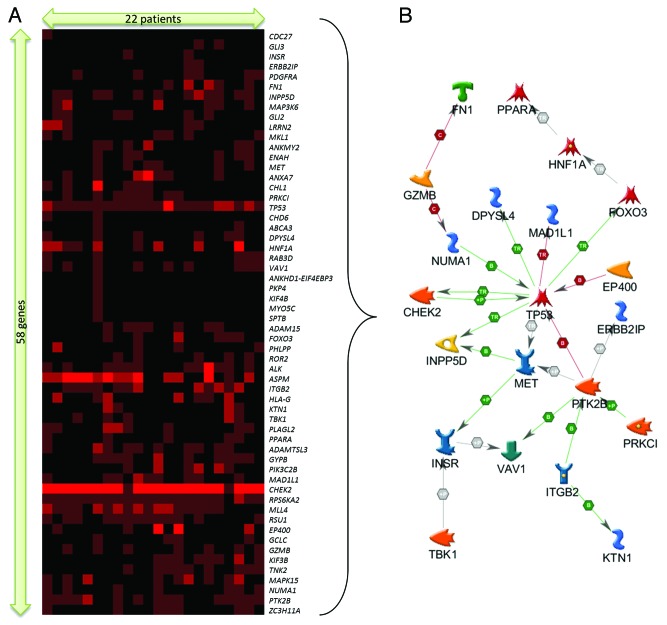
Figure 2. (A) Extracted sub-cluster of mutation matrix belonging to 58 genes and 22 patients, arranged via hierarchical clustering (Kendall–Tau distance, complete linkage). The intensity of the plot corresponds to the number of mutations (inclusive of silent mutations) observed for that gene and patient. (B) Direct interaction gene network of a subset of 21 genes identified from the mutation sub-cluster.

An official website of the United States government
Here's how you know
Official websites use .gov
A
.gov website belongs to an official
government organization in the United States.
Secure .gov websites use HTTPS
A lock (
) or https:// means you've safely
connected to the .gov website. Share sensitive
information only on official, secure websites.
