
Figure 7.
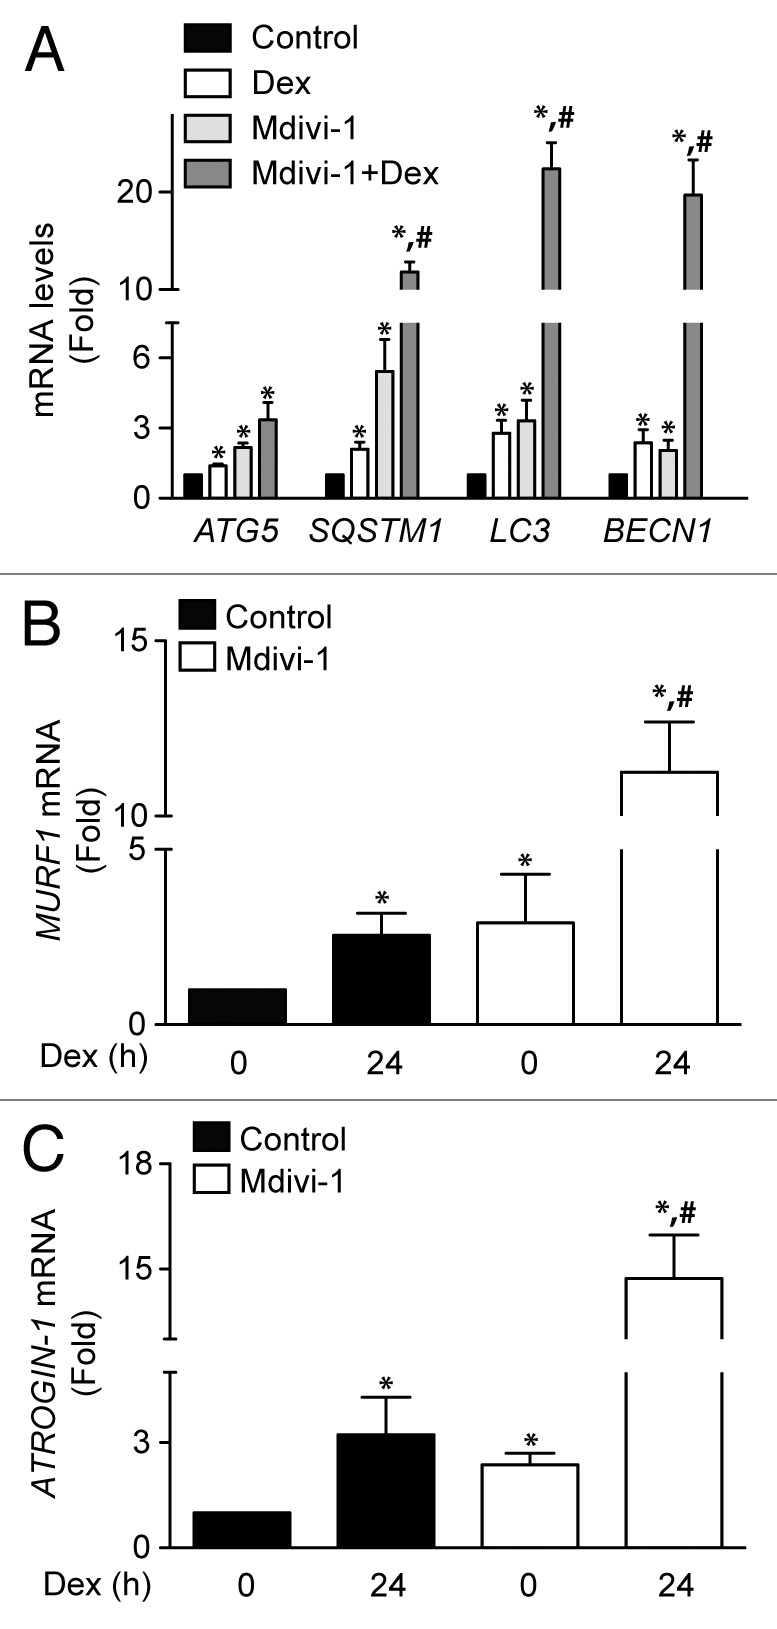
Quantification of ATG5, SQSTM1, LC3, and BECN1 mRNA levels of control, Dex, Mdivi-1, and Dex plus Mdivi-1 incubated L6 myotubes (A). Quantification of MURF1 (B) and ATROGIN-1 (C) mRNA levels in control and Mdivi-1 incubated L6 myotubes. Data: mean ± SEM of at least 3 independent experiments. Statistically significant differences were calculated using ANOVA in combination with a Tukey test for group comparison. *P < 0.05 vs. control, #P < 0.05 vs. Dex.