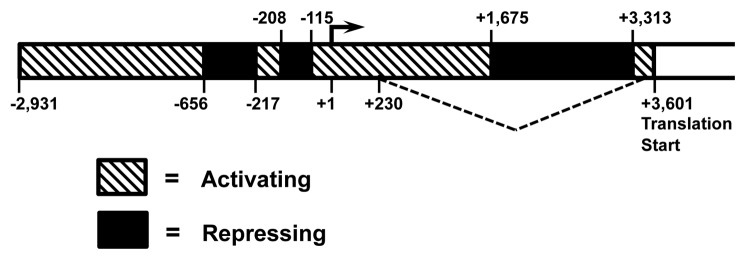
Figure 4. Diagram summarizing activating and repressing regions in Rad51 promoter in cancerous cells. The diagram is a compilation of data shown in Figure 1C and D, where the activity of Rad51 promoter constructs containing various deletions was tested in HT1080 and HeLa cells. Regions that activate expression are between −2931 to −656, −217 to −208, and −115 to +1675. Regions that downregulate expression are between −656 to −217, −208 to −115, and +1675 to +3313.
