
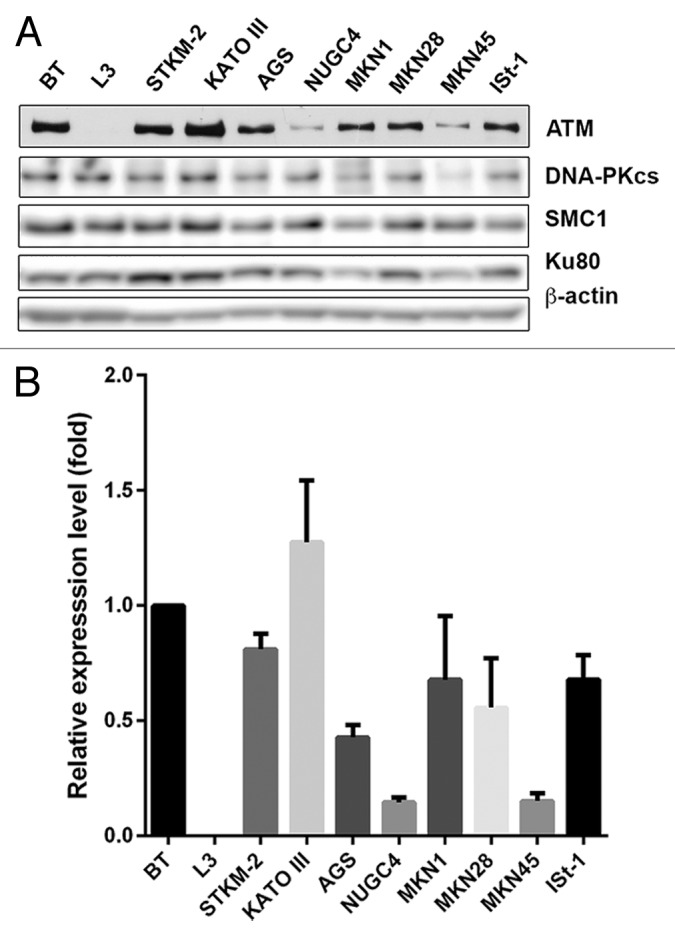
Figure 1. Relative levels of ATM in the gastric cancer cell lines STKM2, KATOIII, AGS, NUGC4, MKN1, MKN28, MKN45, and ISt-1 compared with a control lymphoblastoid cell line C35ABR (BT) and an A-T patient-derived lymphoblastoid cell line (L3). (A) Western blots were probed with antibodies to ATM, DNA-PKcs, SMC1, Ku80, and β−actin as indicated and visualized on a Fuji LAS 4000 imager. (B) ATM protein levels were quantitated, normalized to SMC1 expression and compared with expression in BT cells. n = 3. Error bars denote SEM.