
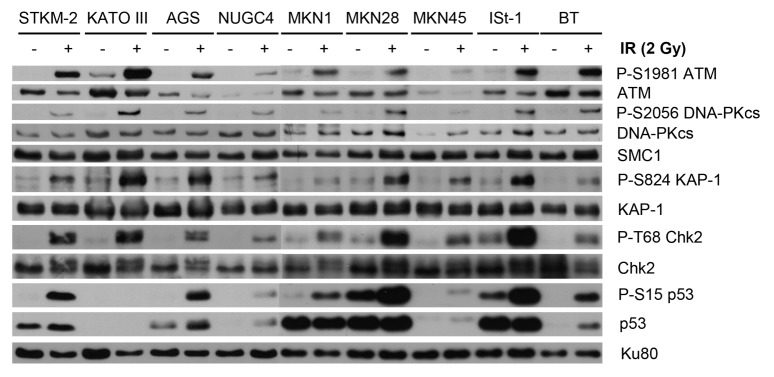
Figure 2. DNA damage induced signaling in the panel of gastric cancer cell lines. The panel of gastric cancer cell lines and BT control cells were exposed to 2 Gy IR and harvested following 1 h. Whole-cell extracts (25 µg total protein) were analyzed by SDS PAGE and immunoblotted for autophosphorylation of ATM on Ser1981 (P-S1981), phosphorylation of DNAPKcs on Ser2056 (P-S2056), phosphorylation of KAP-1 on Ser824 (P-S824), phosphorylation of Chk2 on Thr68 (P-T68), and phosphorylation of p53 on Ser15 (P-S15). Total ATM, KAP-1, Chk2, Ku80, and p53 protein levels are also shown. SMC1 is shown as a loading control.