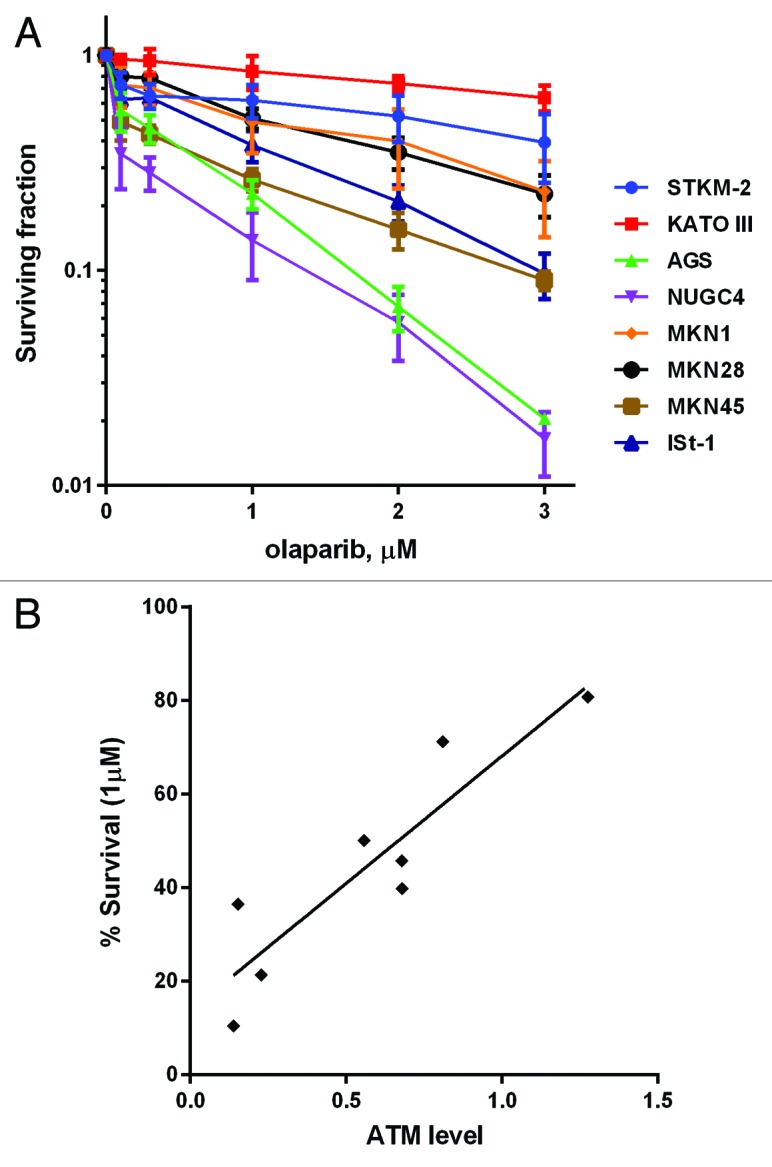
Figure 4. Clonogenic survival of gastric cancer cells after treatment with olaparib. (A) Cells were seeded and 4 h later olaparib as added to 0.1–3.0 µM as indicated. Plates were incubated 10 d prior to staining. (B) The Spearman correlation coefficient between relative levels of ATM protein and cellular survival by olaparib was calculated to be 0.8143 (P = 0.0022). Each point is in triplicate in 3 independent experiments. Error bars represent SEM.
