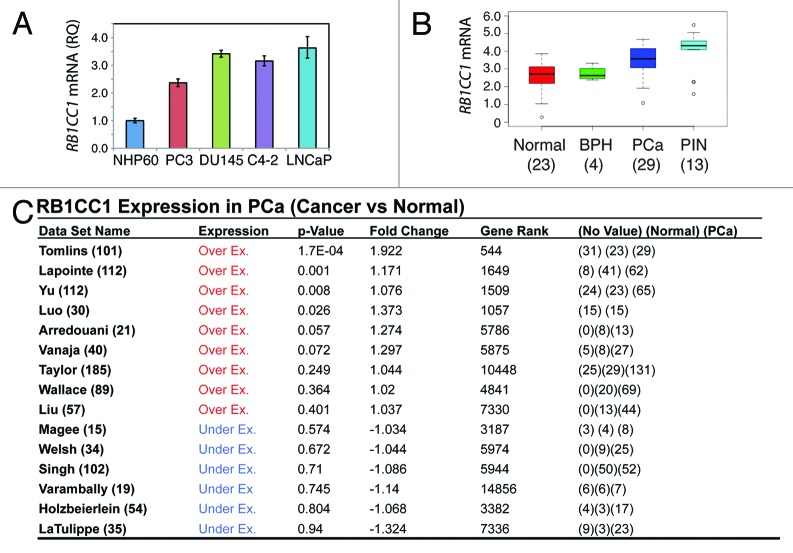
Figure 8. Unexpected (over)expression of RB1CC1 in PCa cells and HPCa samples. (A) qRT-PCR analysis showing increased RB1CC1 mRNA levels in PCa cells compared with NHP60 cells. (B) Elevated RB1CC1 mRNA levels in PIN and HPCa samples. The relative mRNA expression values were summarized from Tomlins et al. (ref. 38). (C) Elevated RB1CC1 mRNA levels in HPCa samples in the majority of the 15 Oncomine data sets. In the first column, the total number of cases was indicated. In the last column, numbers in parentheses indicate the numbers for no value, normal, and PCa, respectively.

An official website of the United States government
Here's how you know
Official websites use .gov
A
.gov website belongs to an official
government organization in the United States.
Secure .gov websites use HTTPS
A lock (
) or https:// means you've safely
connected to the .gov website. Share sensitive
information only on official, secure websites.
