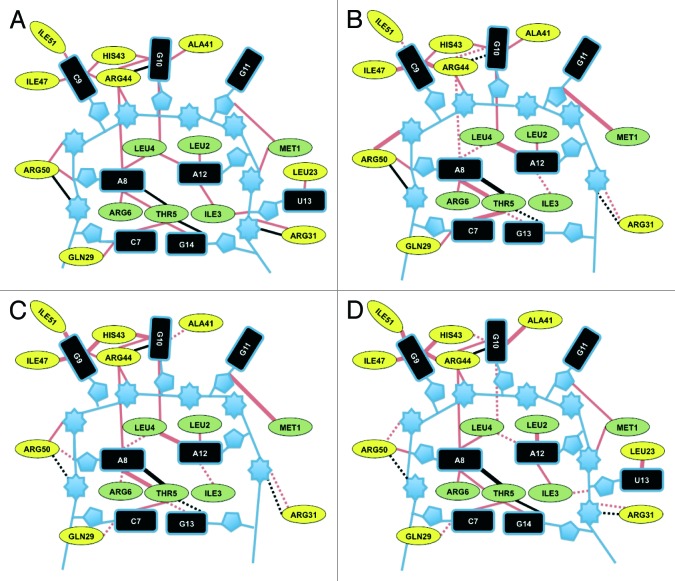
Figure 4. Schematic representation of changes in the RNA-RsmE interactions with hcnA-RsmE as a reference. The interactions of the hcnA (A), hcnAΔU (B), pltA (C) and pltA+U (D) oligomers with RsmE are shown. Red and black lines represent van der Waals interactions and hydrogen bonds, repectively. Changes relative to the RsmE-hcnA interaction (i.e., differences of > 20% in all encountered interactions) are represented as follows: thick lines, more van der Waals and hydrogen bond interactions; dashed lines, fewer van der Waals and hydrogen bond interactions. The protein residues of the RsmE N terminus are colored green and the C-terminal residues are colored yellow. The numbers of interactions were calculated with Entangle program.

An official website of the United States government
Here's how you know
Official websites use .gov
A
.gov website belongs to an official
government organization in the United States.
Secure .gov websites use HTTPS
A lock (
) or https:// means you've safely
connected to the .gov website. Share sensitive
information only on official, secure websites.
