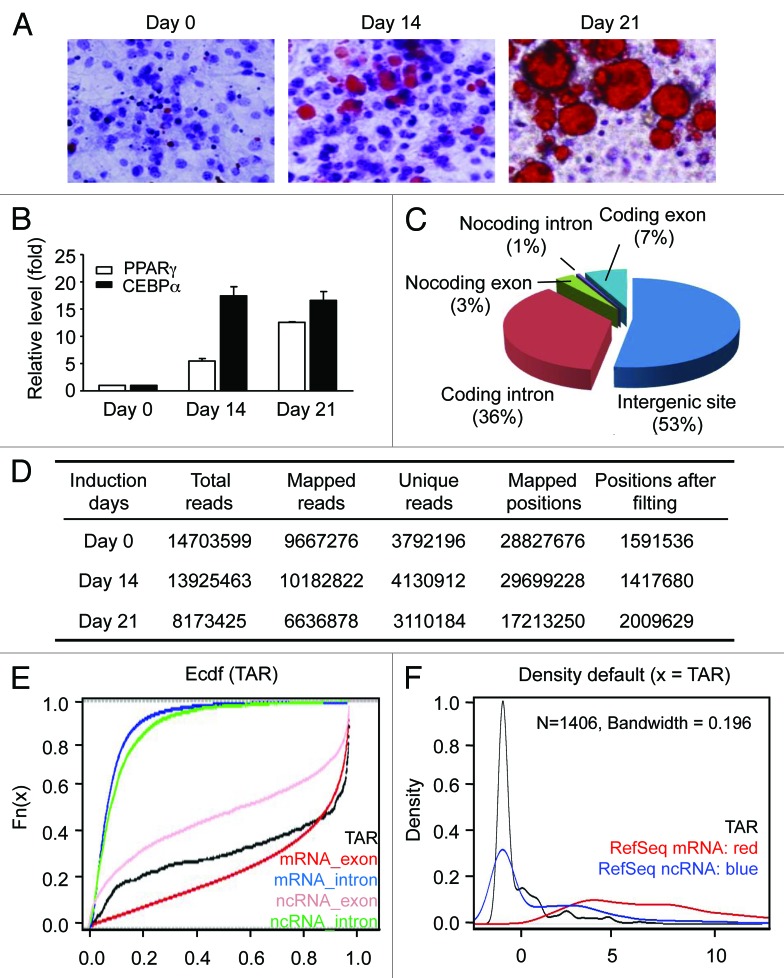
Figure 1. In vitro adipogenesis and RNA sequencing. (A) Oil Red O staining of 3T3-L1 cells during adipogenesis. After the induction of differentiation (day 0), cultured cells are sampled at the indicated time points and stained with Oil Red O. For each time point, the numbers of the lipid-accumulated and lipid-unaccumulated cells were determined by visual check. The ratios of lipid-accumulated cells vs. lipid-unaccumulated cells are 0, 0.32 and 1.22 for day 0, day 14 and day 21. (B) Expression levels of PPARγ and CEBPα measured by RT-qPCR. Expression is plotted as fold-change relative to day 0 (mean ± sd). (C) Reads-mapping in different RNA categories. (D) RNA-seq data location and classification on mice genome (MM9). (E) Conservation analysis. Mean phastCons score, an empirically cumulative distribution of mean phastCons value, is used to evaluate the conservation of TARs. RefSeq mRNA exon, red; RefSeq mRNA intron, blue; RefSeq non-coding RNA intron, pink and RefSeq non-coding RNA intron, green. X axis indicates phastCons score and Y axis indicates the cumulative frequency. (F) Coding potential analysis. CPC (coding potential calculator) are used to evaluate the coding potential of TARs. The density plot of the CPC coding potential score is showed in red for RefSeq mRNA, in blue for RefSeq ncRNA and in black for novel intergenic TARs. X axis indicates CPC coding potential score and Y axis indicates the density.

An official website of the United States government
Here's how you know
Official websites use .gov
A
.gov website belongs to an official
government organization in the United States.
Secure .gov websites use HTTPS
A lock (
) or https:// means you've safely
connected to the .gov website. Share sensitive
information only on official, secure websites.
