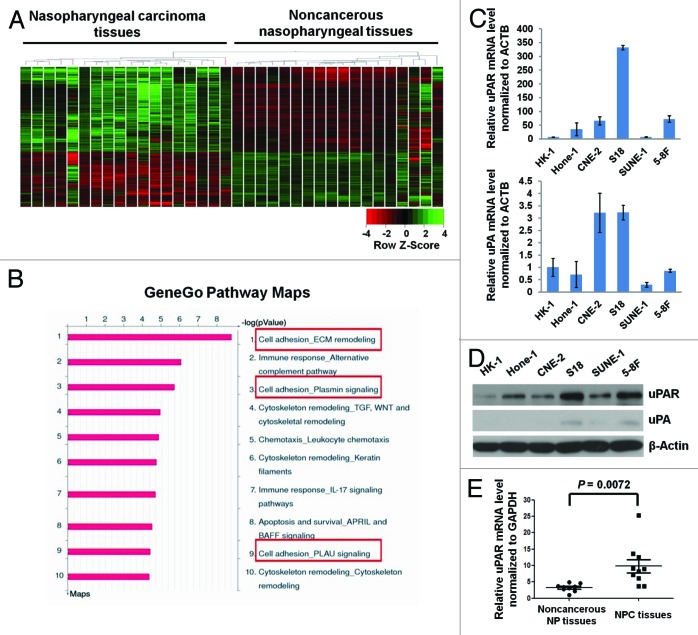
Figure 1. uPAR expression is elevated in NPC tissues, and the highest expression is observed in highly metastatic cells. (A) A heat map showing the expression pattern of 41 091 genes in NPC vs. non-cancerous nasopharyngeal tissues derived from unsupervised clustering analysis. Red or green reflects low or high expression, respectively, as indicated in the scale bar (Raw Z score). (B) The pathway maps derived from the GeneGo Metacore analysis of microarray data sets of 2992 differentially expressed genes. The top 10 scored (log transformed P value) pathways affected by these genes are displayed. All the framed 3 pathways cover uPA–uPAR signaling. (C) The relative uPAR and uPA mRNA levels (normalized to ACTB) in NPC cells as assessed by quantitative real-time PCR. All data were compared with the control (uPA expression in HK-1 cells). Column, mean; error bar, ± SD (from triplicate replications). (D) uPAR and uPA protein levels in NPC cells determined by immunoblotting. Note, the highest expression of uPAR protein was observed in the highly metastatic S18 and 5-8F cell lines. (E) The relative uPAR mRNA levels (normalized to GAPDH) in 10 NPC vs. 9 non-cancerous nasopharyngeal tissue samples determined by real-time PCR. P values were calculated using the Student t test.

An official website of the United States government
Here's how you know
Official websites use .gov
A
.gov website belongs to an official
government organization in the United States.
Secure .gov websites use HTTPS
A lock (
) or https:// means you've safely
connected to the .gov website. Share sensitive
information only on official, secure websites.
