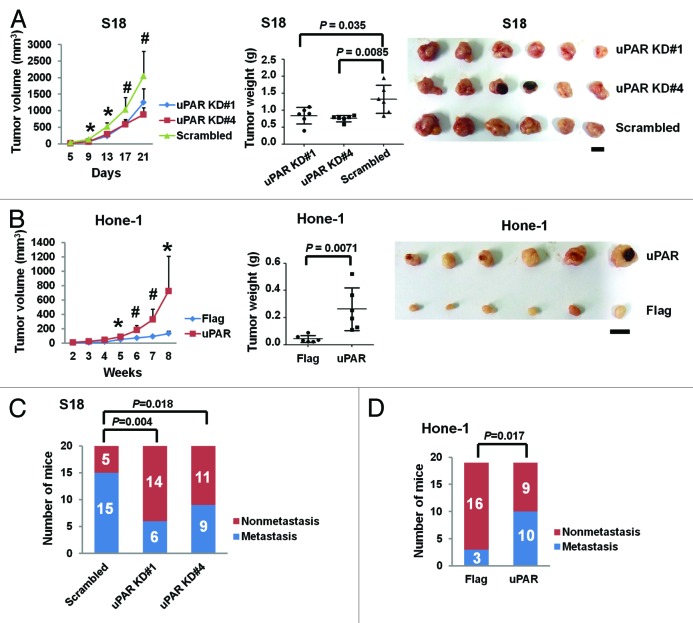
Figure 4. uPAR expression promotes the growth and metastasis of NPC tumors in vivo. (A) The uPAR knockdown S18 (#1 and #4) cells and the scrambled control cells were subcutaneously injected into nude mice. The growth curve (left) indicates S18 growth suppression upon uPAR knockdown in vivo. The terminal tumor weights (middle) are also decreased compared with the scrambled controls. The photographs of isolated tumors are displayed on the right. *P < 0.001, #P < 0.05 for uPAR KD cells relative to the scrambled control (Student t test). The results are presented as the mean ± SD, n = 6 per group. Scale bar, 1 cm. (B) The Hone-1 cells expressing uPAR cDNA display increased growth rates (left) and terminal tumor weights (middle) compared with the Flag control in vivo. Photograph of isolated tumors are displayed on the right. *P < 0.05, #P < 0.01 relative to the Flag control (Student t test). The results are presented as the mean ± SD, n = 6 per group. Scale bar, 1 cm. (C) The in vivo metastasis rates of uPAR knockdown S18 cells. The proportion of popliteal LN metastases was significantly reduced upon uPAR knockdown in S18 cells (n = 20 per group). (D) The in vivo metastasis rates of uPAR-overexpressing Hone-1. The metastasis rate was significantly increased upon uPAR overexpression in Hone-1 cells (n = 19 per group). P values were calculated using a chi-square test.

An official website of the United States government
Here's how you know
Official websites use .gov
A
.gov website belongs to an official
government organization in the United States.
Secure .gov websites use HTTPS
A lock (
) or https:// means you've safely
connected to the .gov website. Share sensitive
information only on official, secure websites.
