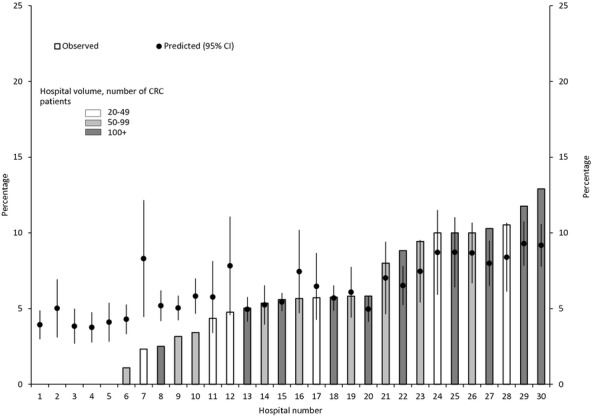
Figure 2.

Observed and Predicted Variability in Thirty-Day Mortality Based on SEER-Medicare Data from 2000 to 2005 across a Random Sample of Thirty Hospitals with at Least Twenty CRC Patients Based on the Multilevel Model Note. Predicted 30-day mortality, based on the multilevel logistic regression model adjusted for sociodemographic, hospital, clinical, tumor, and treatment characteristics, are plotted as circles above the encrypted hospital identifiers along the horizontal axis. Error bars indicate 95 percent confidence intervals. Hospital-level predicted values were computed by averaging the patient-level predicted probabilities for all patients who were treated at that hospital. Hospitals 1 through 5 had zero observed deaths; thus, there is no bar associated with any of these hospitals.
