
Figure 3.

Illustration of the components used to compute associations between drugs and medical conditions for signal detection using search logs. Each user is associated with a surveillance period (blue line) centered on the time of the user’s first query 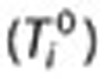 for a drug of interest (D). Associations are estimated by calculating the query rate ratio (QRR)—the ratio between the number of queries for a condition (C) or symptom (S) of interest outside the exclusion period (shaded region) after and before
  . In this example, QRR = (4 + 3 + 2)/(1 + 1 + 1) = 3.