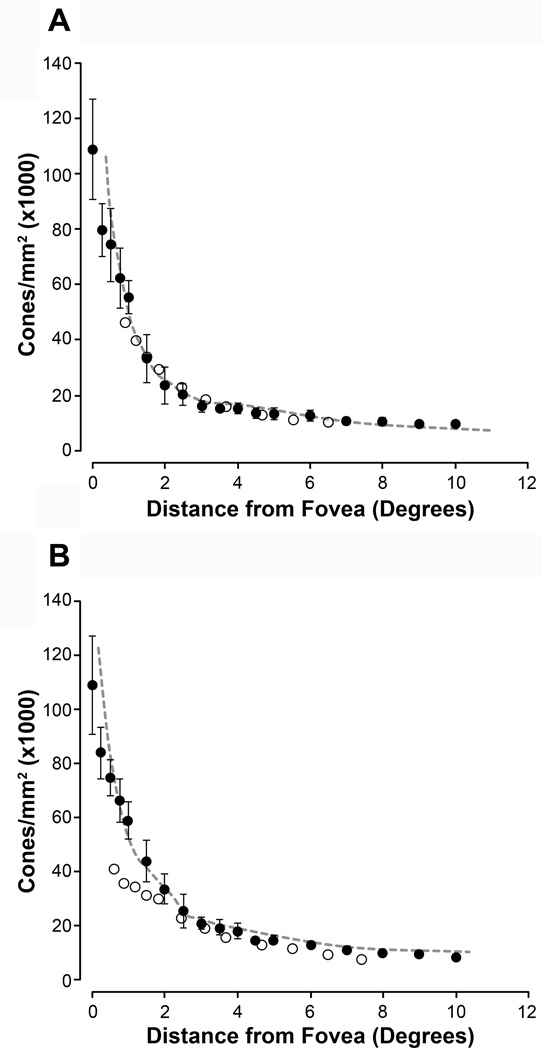
Figure 3.
Cone Density in Control Subjects vs. Previously Published Data. Shown are cone photoreceptor density measurements (filled circles) along the superior and temporal meridians in the grade 0 subjects along the superior (A) and temporal (B) meridia. Error bars represent ±1 standard deviation. Dashed gray line and open circles represent previously published normative data from Curcio et al. (1990) and Song et al. (2011), respectively.21,23 The cone density from our grade 0 subjects corresponds closely with these previously published data sets.

