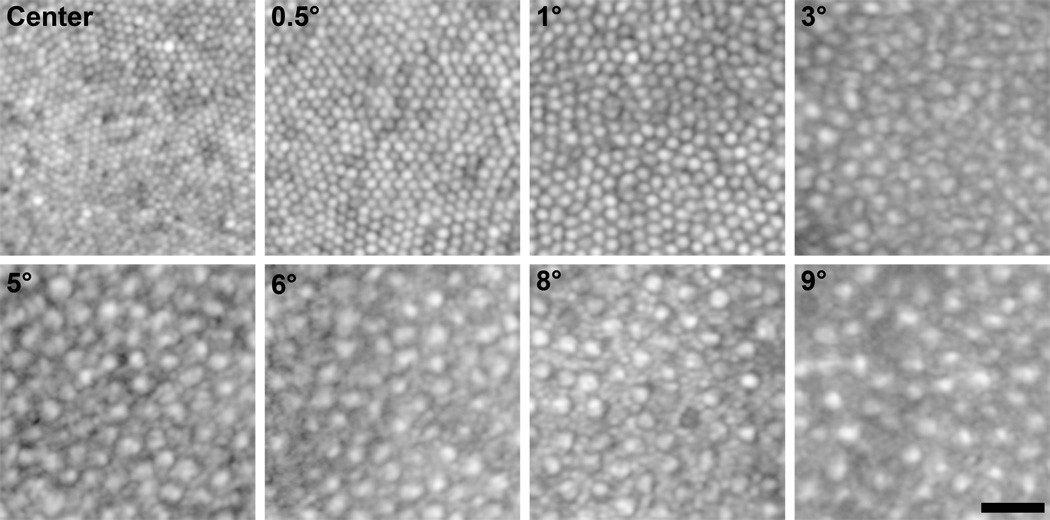
Figure 4.
Example Regions of Interest. Shown are AOLSO images of the cone mosaic from various regions of interest along the temporal meridian in a single subject. Images are shown in logarithmic display to minimize differences in individual photoreceptor brightness, making visualization of cells in the mosaic easier. Labels in each panel represent the retinal eccentricity of that image. Scale bar is 20µm.

