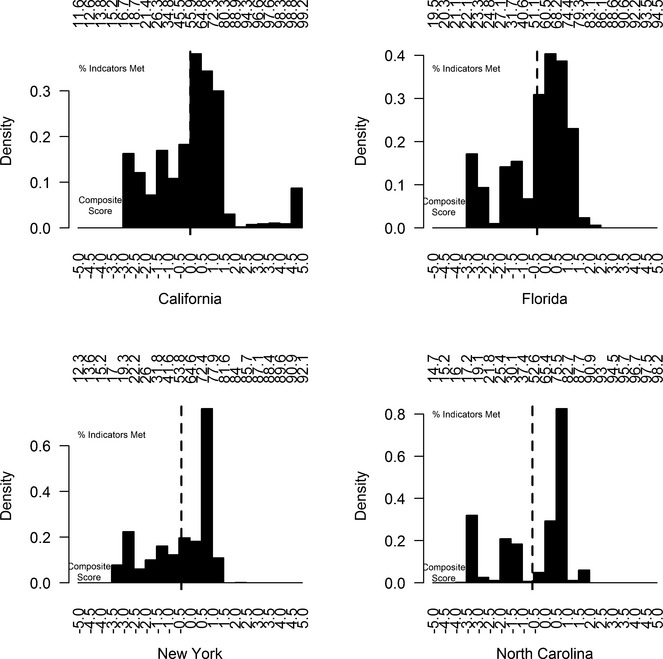
Figure 1.

Distribution of Standardized Composite Score, by State Note. y-axis displays the relative frequency of composite scores. Lower x-axis denotes the composite scale while upper x-axis expresses the composite as the expected percentage of process indicators met. Solid vertical line indicates state mean.
