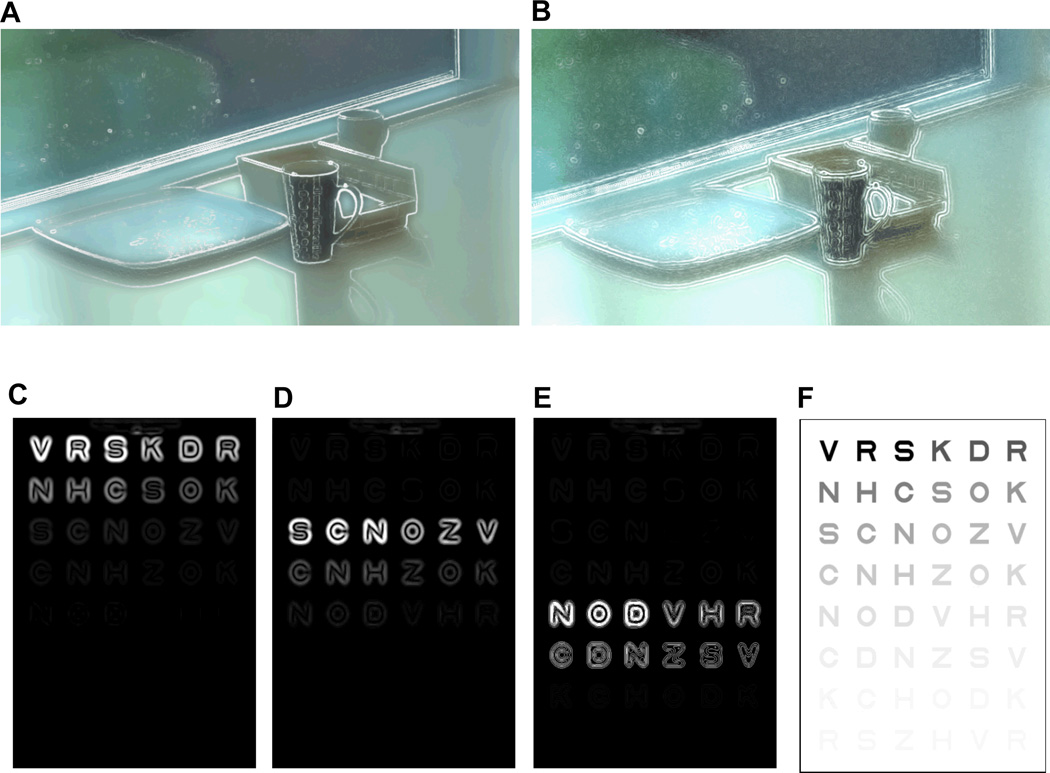
Figure 3.
Illustrations of edge enhanced scene with (A) a positive Laplacian edge detection method and (B) a negative Laplacian edge detection. Note that with positive Laplacian method, the location of edge is whitened, but with negative Laplacian method, surrounding of edges are whitened. (C–E) Illustrations of the effect of selective (positive) contrast enhancement of a Pelli-Robson virtual contrast sensitivity chart (F), calculated with high, medium, and low level contrast ranges, respectively. Note that only the edge information is shown in (C–E), while the overlaid view of the edges and see-through views are shown in (A) and (B). Different scaling levels applied to the images in the top and bottom rows cause the apparent thickness difference of enhanced edges. A color version of this figure is available online at www.optvissci.com.

