
Figure 4. Fitness landscape defines structure–function relationships.
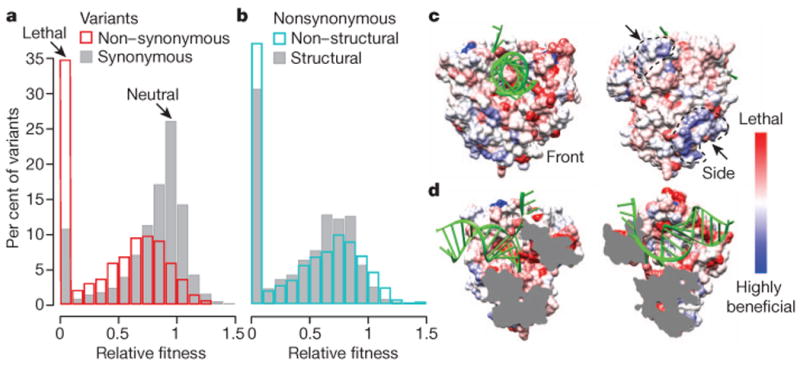
a, b, Distributions of fitness for synonymous (grey) and non-synonymous (red) mutations (a) and for non-synonymous mutations in structural (grey) and non-structural (blue) genes (b). Fitness was determined as described in Methods. C > U and G > A transitions were excluded as we observed indications of hypermutation for these variants. The proportion of lethal variants for each group is likely higher, as not all possible variants were detected. Variants with fitness >1.5 are not shown. c, d, The most fit non-synonymous variant observed for each codon was mapped onto the viral polymerase (3OL6)28 using a red (lethal) to white (neutral) to blue (beneficial) scale. RNA is coloured green. Front and side views show two positively selected surfaces (marked by arrows) (c) and split view shows negative selection along active core and RNA binding sites (d).