
Extended Data Figure 8. Simulation of genetic drift and its impact on fitness measurement.
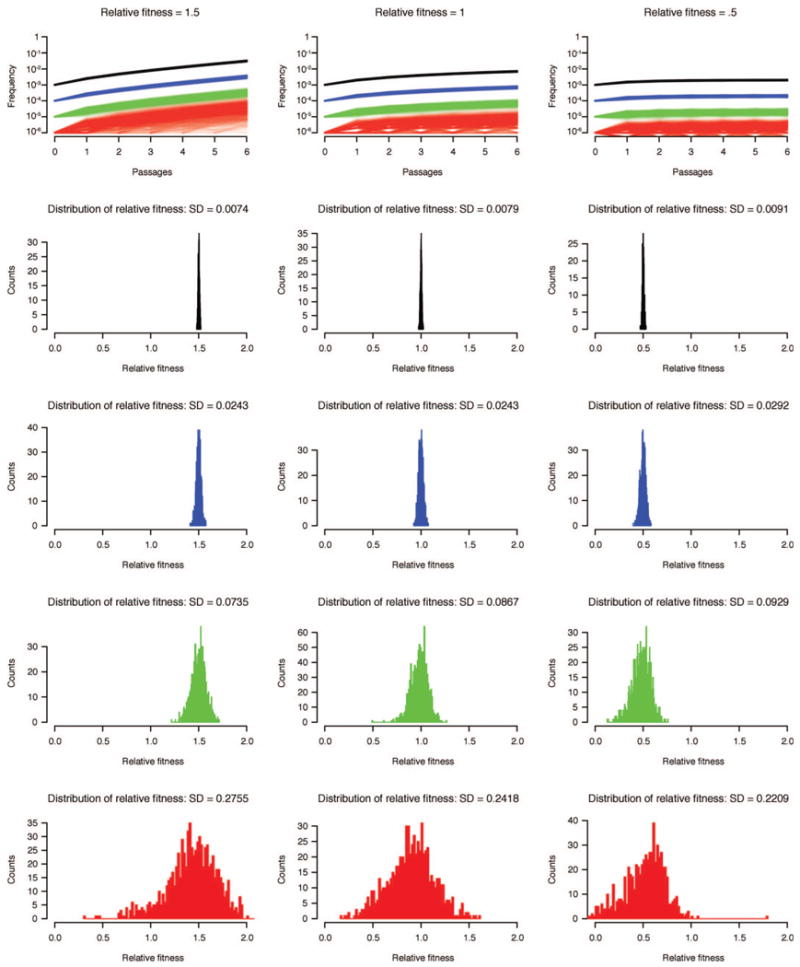
Top row shows one thousand simulations of a mutation-selection-drift process in a population of 106 genomes are shown for mutations initiated at their mutation rate: 10−3 (black), 10−4 (blue), 10−5 (green) and 10−6 (red). Because of the low number of mutations in populations where the mutation rate was set to 10−6, it is common for the population to lose the mutant by drift. As frequency was plotted on alog scale,a frequency of 0 was representedas10−7. The histograms show fitness calculated using a simple mutation-selection model for each simulation. The standard deviation for each set of calculations is noted in the title of each set of simulations. The stronger drift experienced by low frequency variants reduces the accuracy of fitness measurements. To account for this effect, we have incorporated drift into our fitness model.