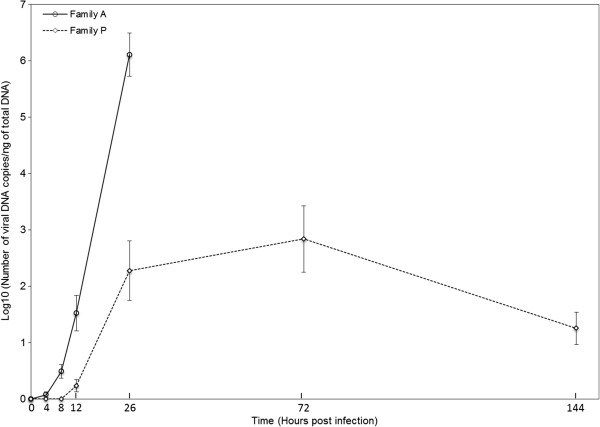
Figure 3.

Virus DNA detection curves by real time quantitative PCR in oyster from families A and P after injection OsHV-1 (average n = 12). In both families, a result of 0 DNA copies/ng of total DNA was reported for negative controls injected with 100 μL of artificial seawater. Error bars represent ± standard deviation.
