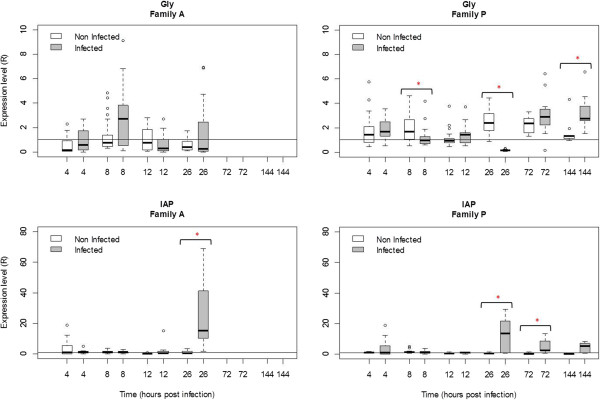
Figure 7.

Relative expression of two selected genes (Gly and IAP) in family A and family P, determined by real time PCR. Gly: Glypican and IAP: Inhibitor of apoptosis. Results at 4, 8, 12, 26, 72 and 144 hours post-infection. Expression levels were normalized to EF (mean ± SD, n = 12). A value = 1 is arbitrarily assigned to controls. *Significant difference of gene expression compared to controls by Mann–Whitney test (p < 0.05).
