
Figure 4.
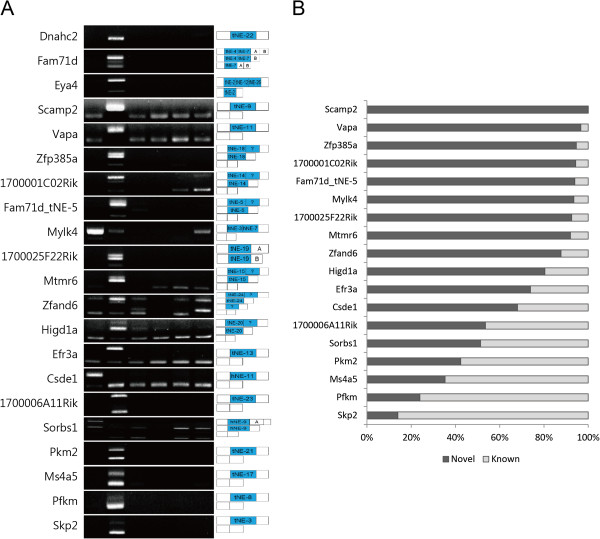
Alternative splicing patterns of the novel isoforms containing the novel exons. (A) Multiple isoforms either with or without the novel exons were produced by RT-PCR. Exon structures amplified by the primers are seen in the right panel, while novel exons are highlighted with blue boxes. (B) The relative expression levels of the isoforms were quantified by ImageJ.