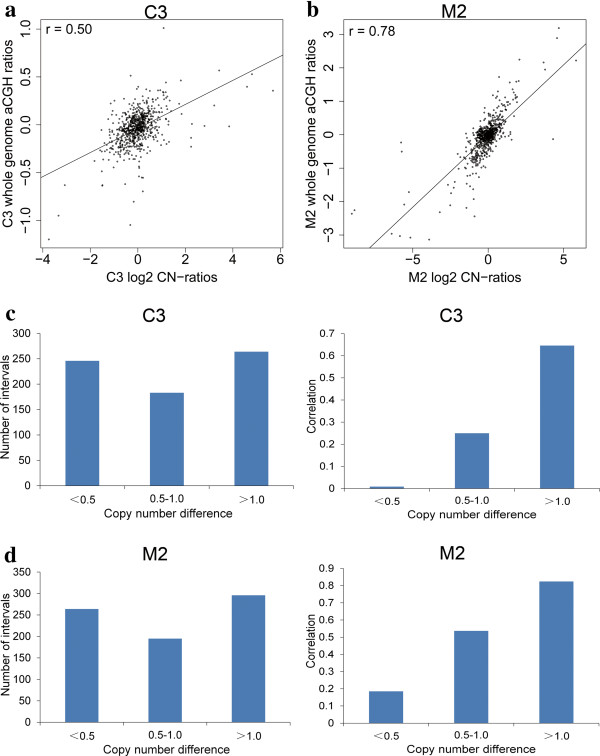
Figure 4.

The correlation between RD estimates and experimental aCGH results. (a) For individual C3, the log2 values of ratios of RD predicted copy numbers (horizontal axis) were compared with probe log2 ratios from whole-genome aCGH (vertical axis), showing a correlation of 0.50.. (b) Another sample, M2, shows a correlation of 0.78. (c) For individual C3 (Landrace), CNV intervals were divided into three groups according to different level of copy number difference between C3 and the reference sample (D4, Duroc). Every group of CNV intervals was used to calculate the correlation between RD estimates and experimental aCGH results, respectively. It is clear that the higher the copy number difference of each interval, the larger the correlation between RD estimates and experimental aCGH results. (d) For another individual (M2, Min pig), impact of copy number difference on the correlation shows similar trend with that in Figure 3c.
