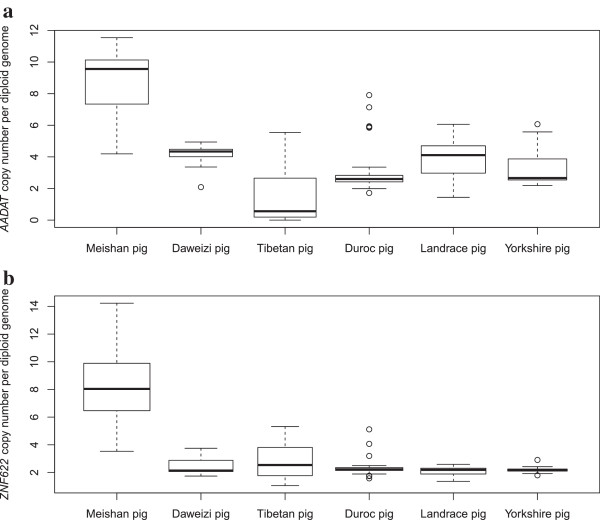
Figure 5.

Box plot of gene copy number quantification for AADAT (a) and ZNF622 (b). The gene copy number was measured by qPCR assays across six pig breeds, including Meishan pig, Daweizi pig, Tibetan pig, Duroc pig, Landrace pig and Yorkshire pig. Boxes indicate the interquartile range between the first and third quartiles, and the bold line indicates the median. Whiskers represent the minimum and maximum within 1.5 times the interquartile range from the first and third quartiles. Outliers outside the whiskers are shown as circles.
