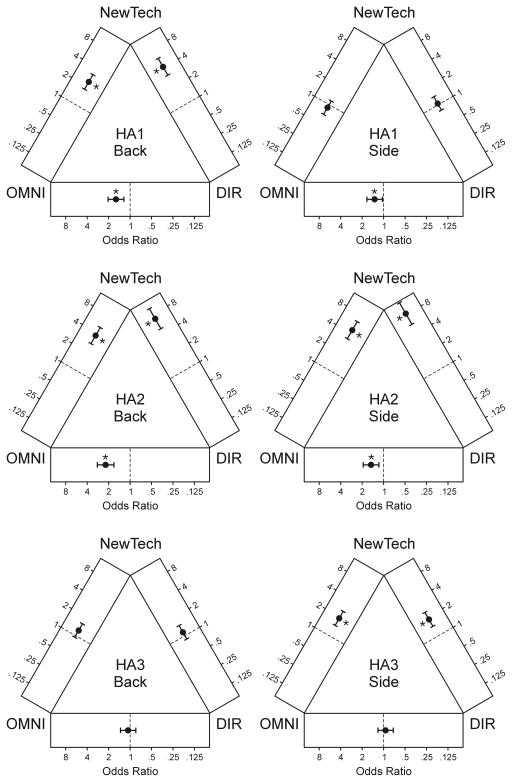
Figure 6.
Results of preference judgment from the back-talker position (left column) and side-talker position (right column) of each hearing aid model. Solid circles represent the odds ratio of preferring the OMNI program (in the comparison of OMNI vs. DIR) and the NewTech program (in the comparisons of NewTech vs. OMNI and NewTech vs. DIR). Error bars indicate the 95% confidence interval.

