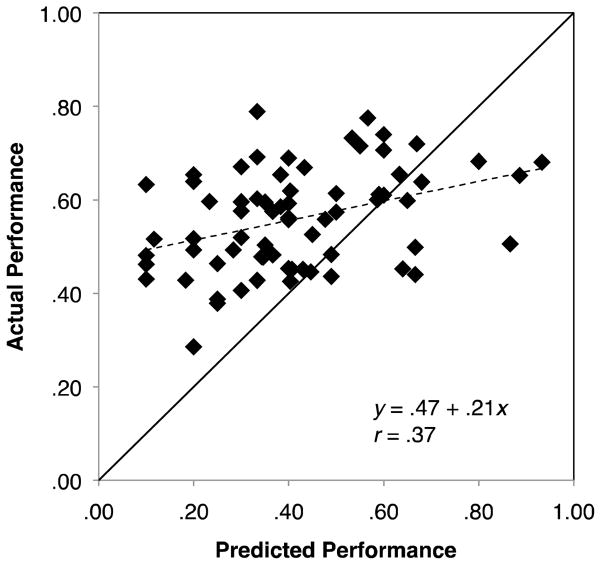
Figure 2.
Actual dual-task tracking performance as a function of predicted dual-task tracking performance, in Experiment 1. Each dot represents one participant. Values are averaged over n of concurrent n-back task for each participant. The dark diagonal line represents perfect calibration, and the dotted line is the regression line.

