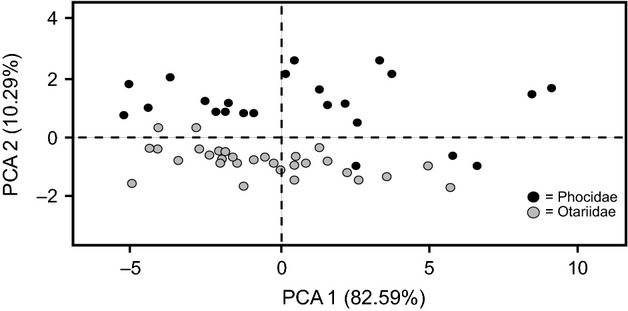
Figure 3.

Bivariate plot of principal component one versus principal component two, based on the average 14 Log10 transformed cranial measurements for 34 distinctive species and subspecies of otariid and phocid seal. Male and female otariids, Mirounga, Hydrurga, Cystophora, and Halichoerus are treated as separate data points.
