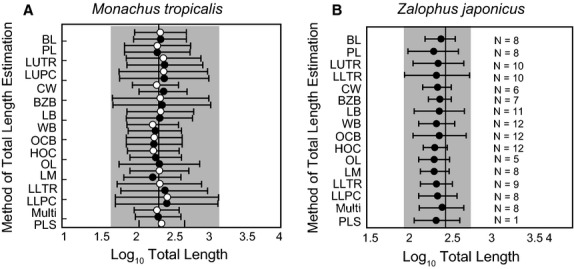
Figure 7.

Comparisons of the average estimates of log total length for Monachus tropicalis (left) and Zalophus japonicus (right) for each regression equation, with the known total length of an individual from the literature (vertical line) (Ward, 1887; Itoo & Inoué, 1993). White circles are estimates of average female total length (n = 4) and black circles are estimates of average male total length (n = 4). Sample size for M. tropicalis is four for each sex. Sample sizes for Z. japonicus are listed besides each regression. Estimates are represented by circles, with brackets representing standard error of the estimate calculated for each equation. Estimates using the multivariate regression were calculated using the all subsets equation.
